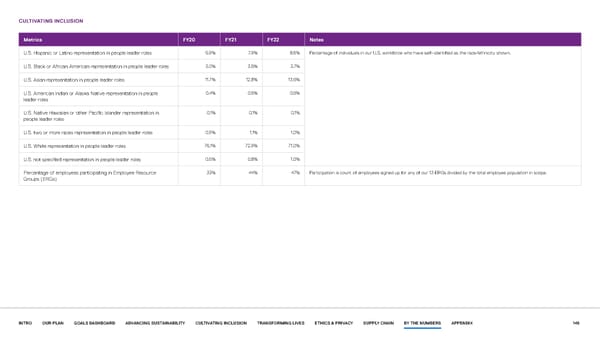
CULTIVATING INCLUSION Metrics FY20 FY21 FY22 Notes U.S. Hispanic or Latino representation in people leader roles 6.9% 7.9% 8.5% Percentage of individuals in our U.S. workforce who have self–identified as the race/ethnicity shown. U.S. Black or African American representation in people leader roles 3.0% 3.5% 3.7% U.S. Asian representation in people leader roles 11.7% 12.8% 13.6% U.S. American Indian or Alaska Native representation in people 0.4% 0.6% 0.6% leader roles U.S. Native Hawaiian or other Pacific Islander representation in 0.1% 0.1% 0.1% people leader roles U.S. two or more races representation in people leader roles 0.9% 1.1% 1.0% U.S. White representation in people leader roles 76.1% 72.9% 71.0% U.S. not specified representation in people leader roles 0.6% 0.8% 1.0% Percentage of employees participating in Employee Resource 33% 44% 47% Participation is count of employees signed up for any of our 13 ERGs divided by the total employee population in scope. Groups (ERGs) INTRO OUR PLAN GOALS DASHBOARD ADVANCING SUSTAINABILITY CULTIVATING INCLUSION TRANSFORMING LIVES ETHICS & PRIVACY SUPPLY CHAIN BY THE NUMBERS APPENDIX 146
 Our purpose in action | Dell Page 145 Page 147