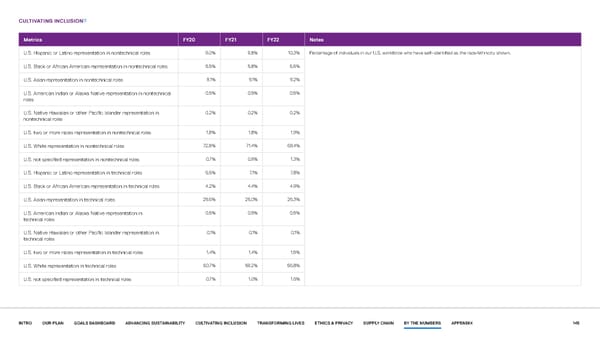
72 CULTIVATING INCLUSION Metrics FY20 FY21 FY22 Notes U.S. Hispanic or Latino representation in nontechnical roles 9.0% 9.8% 10.3% Percentage of individuals in our U.S. workforce who have self–identified as the race/ethnicity shown. U.S. Black or African American representation in nontechnical roles 5.5% 5.8% 6.5% U.S. Asian representation in nontechnical roles 9.1% 9.1% 9.2% U.S. American Indian or Alaska Native representation in nontechnical 0.5% 0.5% 0.5% roles U.S. Native Hawaiian or other Pacific Islander representation in 0.2% 0.2% 0.2% nontechnical roles U.S. two or more races representation in nontechnical roles 1.8% 1.8% 1.9% U.S. White representation in nontechnical roles 72.8% 71.4% 69.4% U.S. not specified representation in nontechnical roles 0.7% 0.9% 1.3% U.S. Hispanic or Latino representation in technical roles 6.5% 7.1% 7.8% U.S. Black or African American representation in technical roles 4.2% 4.4% 4.9% U.S. Asian representation in technical roles 25.6% 26.0% 26.3% U.S. American Indian or Alaska Native representation in 0.5% 0.5% 0.5% technical roles U.S. Native Hawaiian or other Pacific Islander representation in 0.1% 0.1% 0.1% technical roles U.S. two or more races representation in technical roles 1.4% 1.4% 1.5% U.S. White representation in technical roles 60.7% 59.2% 56.8% U.S. not specified representation in technical roles 0.7% 1.0% 1.6% INTRO OUR PLAN GOALS DASHBOARD ADVANCING SUSTAINABILITY CULTIVATING INCLUSION TRANSFORMING LIVES ETHICS & PRIVACY SUPPLY CHAIN BY THE NUMBERS APPENDIX 145
 Our purpose in action | Dell Page 144 Page 146