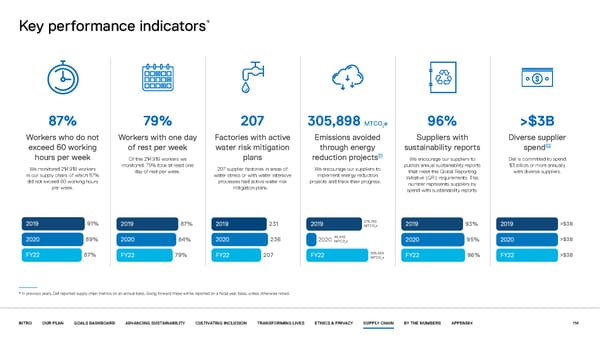
* Key performance indicators 87% 79% 207 305,898 MTCOe 96% >$3B 2 Workers who do not Workers with one day Factories with active Emissions avoided Suppliers with Diverse supplier 52 exceed 60 working of rest per week water risk mitigation through energy sustainability reports spend 51 hours per week Of the 214,919 workers we plans reduction projects We encourage our suppliers to Dell is committed to spend We monitored 214,919 workers monitored, 79% took at least one 207 supplier factories in areas of We encourage our suppliers to publish annual sustainability reports $3 billion or more annually in our supply chain, of which 87% day of rest per week. water stress or with water intensive implement energy reduction that meet the Global Reporting with diverse suppliers. did not exceed 60 working hours processes had active water risk projects and track their progress. Initiative (GRI) requirements. This per week. mitigation plans. number represents suppliers by spend with sustainability reports. ,130 75 2019 91% 2019 7% 2019 231 2019 2 2019 3% 2019 >$3B 8 COe 9 MT 2 ,842 2020 89% 2020 84% 2020 236 2020 48 2020 95% 2020 >$3B COe MT 2 ,898 FY22 7% 305 >$3B 8 FY22 7 FY22 79% 20 FY22 COe FY22 96% FY22 MT 2 * In previous years, Dell reported supply chain metrics on an annual basis. Going forward these will be reported on a fiscal year basis, unless otherwise noted. INTRO OUR PLAN GOALS DASHBOARD ADVANCING SUSTAINABILITY CULTIVATING INCLUSION TRANSFORMING LIVES ETHICS & PRIVACY SUPPLY CHAIN BY THE NUMBERS APPENDIX 114
 Our purpose in action | Dell Page 113 Page 115