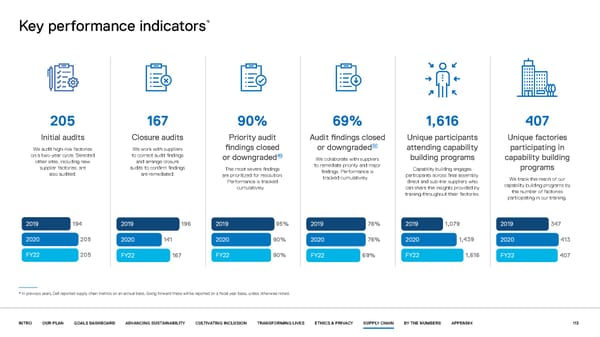
* Key performance indicators 205 167 90% 69% 1,616 407 Initial audits Closure audits Priority audit Audit findings closed Unique participants Unique factories 50 We audit high-risk factories We work with suppliers findings closed or downgraded attending capability participating in on a two-year cycle. Selected to correct audit findings 49 other sites, including new and arrange closure or downgraded We collaborate with suppliers building programs capability building supplier factories, are audits to confirm findings The most severe findings to remediate priority and major Capability building engages programs also audited. are remediated. are prioritized for resolution. findings. Performance is participants across final assembly, Performance is tracked tracked cumulatively. direct and sub-tier suppliers who We track the reach of our cumulatively. can share the insights provided by capability building programs by training throughout their factories. the number of factories participating in our training. 2019 194 2019 2019 2019 2019 79 2019 196 95% 76% 1,0 347 2020 205 2020 141 2020 90% 2020 76% 2020 1,439 2020 413 FY22 205 FY22 7 FY22 90% FY22 1,616 FY22 16 FY22 7 69% 40 * In previous years, Dell reported supply chain metrics on an annual basis. Going forward these will be reported on a fiscal year basis, unless otherwise noted. INTRO OUR PLAN GOALS DASHBOARD ADVANCING SUSTAINABILITY CULTIVATING INCLUSION TRANSFORMING LIVES ETHICS & PRIVACY SUPPLY CHAIN BY THE NUMBERS APPENDIX 113
 Our purpose in action | Dell Page 112 Page 114