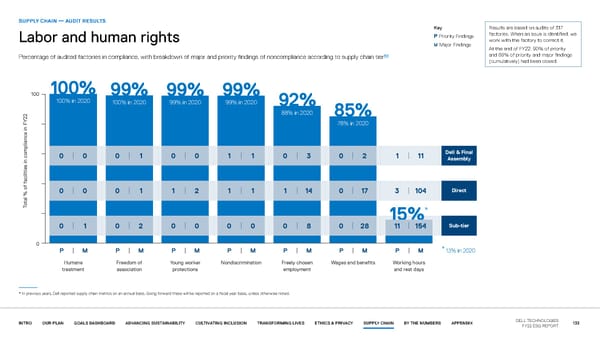
SUPPLY CHAIN — AUDIT RESULTS Key Results are based on audits of 317 P Priority Findings factories. When an issue is identified, we Labor and human rights work with the factory to correct it. M Major Findings At the end of FY22, 90% of priority 60 and 69% of priority and major findings Percentage of audited factories in compliance, with breakdown of major and priority findings of noncompliance according to supply chain tier (cumulatively) had been closed. 100100100100100100100 100%100%100%100%100%100%100% 99%99%99%99%99%99%99% 99%99%99%99%99%99%99% 99%99%99%99%99%99%99% 100% in 2100% in 2100% in 2100% in 2100% in 2100% in 2100% in 2000000022222220000000 100% in 2100% in 2100% in 2100% in 2100% in 2100% in 2100% in 2000000022222220000000 99% in 299% in 299% in 299% in 299% in 299% in 299% in 2000000022222220000000 99% in 299% in 299% in 299% in 299% in 299% in 299% in 2000000022222220000000 92%92%92%92%92%92%92% 22222222222222 88% in 288% in 288% in 288% in 288% in 288% in 288% in 2000000022222220000000 85%85%85%85%85%85%85% 77777778% in 28% in 28% in 28% in 28% in 28% in 28% in 2000000022222220000000 00 Dell & FinalDell & FinalDell & FinalDell & FinalDell & FinalDell & FinalDell & Final 0000000 0000000 00000 1111111 0000000 0000000 1111111 1111111 0000000 3333333 0000000 2222222 1111111 11111111111111 AssemblyAssemblyAssemblyAssemblyAssemblyAssemblyAssembly acilities in compliance in FYacilities in compliance in FYacilities in compliance in FYacilities in compliance in FYacilities in compliance in FYacilities in compliance in FYacilities in compliance in FY f ff ff ff ff ff ff f Direct 0000000 1111111 111111 1111111 DirDirDirDirDirDirectectectectectect al % oal % oal % oal % oal % oal % oal % o 0000000 0000000 1111111 2222222 1 1111111 14141414141414 0000000 17171717171717 3333333 104104104104104104104 TTTTTTTooooooottttttt ******* 15%15%15%15%15%15%15% Sub-tier 22 Sub-Sub-Sub-Sub-Sub-Sub-tiertiertiertiertiertier 0000000 1111111 0000000 22222 0000000 0000000 0000000 8888888 28 0000000 0000000 0000000 282828282828 11111111111111 154154154154154154154 0000000 MMM * PPP MMMMMMM PPPPPPP MMMM MM PPPP PP MMMMMMM PPPPPPP MMMMM PPPPPPP MMMMMMM PPPPPPP MMMMMMM PPPPPPP MMMMMMM PPPPP 13% in 2020 Humane Humane Humane Humane Humane Humane Humane FrFrFrFrFrFrFreedom oeedom oeedom oeedom oeedom oeedom oeedom of f f f f f f YYYYYYYoung woung woung woung woung woung woung workorkorkorkorkorkorker er er er er er er ondiscriminaondiscriminaondiscriminaondiscriminaondiscriminaondiscriminaondiscriminationtiontiontiontiontiontion FrFrFrFrFrFrFreely chosen eely chosen eely chosen eely chosen eely chosen eely chosen eely chosen WWWWWWWages and beneages and beneages and beneages and beneages and beneages and beneages and benefififififififitststststststs WWWWWWWorking hourorking hourorking hourorking hourorking hourorking hourorking hours s s s s s s trtrtrtrtrtrtreaeaeaeaeaeaeatmentmentmentmentmentmentmenttttttt associaassociaassociaassociaassociaassociaassociationtiontiontiontiontiontion prprprprprprproooooootttttttececececececectionstionstionstionstionstionstions emploemploemploemploemploemploemploymenymenymenymenymenymenyment t t t t t t and rand rand rand rand rand rand rest daest daest daest daest daest daest daysysysysysysys * In previous years, Dell reported supply chain metrics on an annual basis. Going forward these will be reported on a fiscal year basis, unless otherwise noted. INTRO OUR PLAN GOALS DASHBOARD ADVANCING SUSTAINABILITY CULTIVATING INCLUSION TRANSFORMING LIVES ETHICS & PRIVACY SUPPLY CHAIN BY THE NUMBERS APPENDIX DELL TECHNOLOGIES 133 FY22 ESG REPORT
 Our purpose in action | Dell Page 132 Page 134