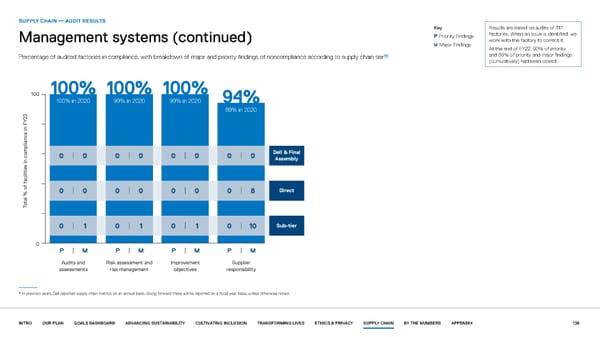
SUPPLY CHAIN — AUDIT RESULTS Key Results are based on audits of 317 P Priority Findings factories. When an issue is identified, we Management systems (continued) work with the factory to correct it. M Major Findings At the end of FY22, 90% of priority 65 and 69% of priority and major findings Percentage of audited factories in compliance, with breakdown of major and priority findings of noncompliance according to supply chain tier (cumulatively) had been closed. 100100100100 100%100%100%100% 100%100%100%100% 100%100%100%100% 100% in 2100% in 2100% in 2100% in 2000022220000 99% in 299% in 299% in 299% in 2000022220000 99% in 299% in 299% in 299% in 2000022220000 94%94%94%94% 89% in 289% in 289% in 289% in 2000022220000 00 0000 0000 0000 0000 0000 Dell & FinalDell & FinalDell & FinalDell & Final 0000 00 0000 AssemblyAssemblyAssemblyAssembly acilities in compliance in Facilities in compliance in Facilities in compliance in Facilities in compliance in F f ff ff ff f Direct 0000 0000 0000 0000 0000 0000 0000 8888 DirDirDirectectect al % oal % oal % oal % o TTTT oooo tttt Sub-tier 0000 1111 0000 1111 0000 1111 0000 10101010 Sub-Sub-Sub-tiertiertier 0000 PPPP MMMM PPPP MMMM PPPP MMMM PPPP MMMM AAAAuditudituditudits ands ands ands and Risk assessmenRisk assessmenRisk assessmenRisk assessment andt andt andt and ImprImprImprImproooovvvvemenemenemenementttt SupplierSupplierSupplierSupplier assessmenassessmenassessmenassessmenttttssss risk managemenrisk managemenrisk managemenrisk managementttt objecobjecobjecobjectivtivtivtiveseseses rrrresponsibilityesponsibilityesponsibilityesponsibility * In previous years, Dell reported supply chain metrics on an annual basis. Going forward these will be reported on a fiscal year basis, unless otherwise noted. INTRO OUR PLAN GOALS DASHBOARD ADVANCING SUSTAINABILITY CULTIVATING INCLUSION TRANSFORMING LIVES ETHICS & PRIVACY SUPPLY CHAIN BY THE NUMBERS APPENDIX 138
 Our purpose in action | Dell Page 137 Page 139