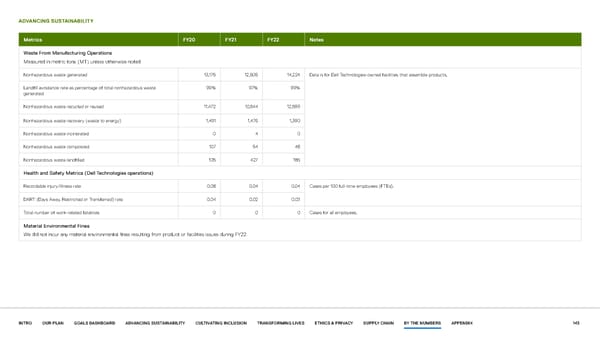
ADVANCING SUSTAINABILITY Metrics FY20 FY21 FY22 Notes Waste From Manufacturing Operations Measured in metric tons (MT) unless otherwise noted Nonhazardous waste generated 13,175 12,505 14,224 Data is for Dell Technologies-owned facilities that assemble products. Landfill avoidance rate as percentage of total nonhazardous waste 99% 97% 99% generated Nonhazardous waste recycled or reused 11,472 10,544 12,599 Nonhazardous waste recovery (waste to energy) 1,491 1,476 1,390 Nonhazardous waste incinerated 0 4 0 Nonhazardous waste composted 107 54 48 Nonhazardous waste landfilled 105 427 186 Health and Safety Metrics (Dell Technologies operations) Recordable injury/illness rate 0.08 0.04 0.04 Cases per 100 full-time employees (FTEs). DART (Days Away, Restricted or Transferred) rate 0.04 0.02 0.03 Total number of work-related fatalities 0 0 0 Cases for all employees. Material Environmental Fines We did not incur any material environmental fines resulting from product or facilities issues during FY22. INTRO OUR PLAN GOALS DASHBOARD ADVANCING SUSTAINABILITY CULTIVATING INCLUSION TRANSFORMING LIVES ETHICS & PRIVACY SUPPLY CHAIN BY THE NUMBERS APPENDIX 143
 Our purpose in action | Dell Page 142 Page 144