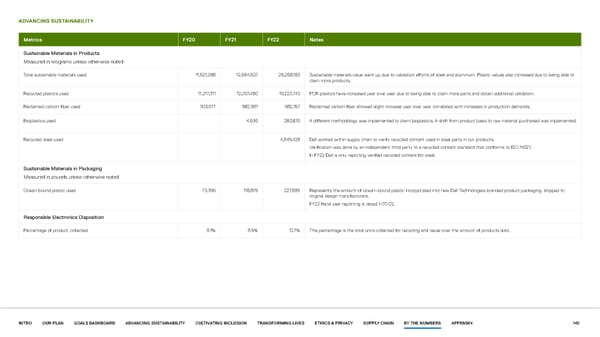
ADVANCING SUSTAINABILITY Metrics FY20 FY21 FY22 Notes Sustainable Materials in Products Measured in kilograms unless otherwise noted Total sustainable materials used 11,521,288 12,594,607 25,258,183 Sustainable materials value went up due to validation efforts of steel and aluminium. Plastic values also increased due to being able to claim more products. Recycled plastics used 11,217,311 12,007,480 19,223,743 PCR plastics have increased year over year due to being able to claim more parts and obtain additional validation. Reclaimed carbon fiber used 303,977 582,591 682,157 Reclaimed carbon fiber showed slight increase year over year correlated with increases in production demands. Bioplastics used 4,536 280,876 A different methodology was implemented to claim bioplastics. A shift from product basis to raw material purchased was implemented. Recycled steel used 4,945,428 Dell worked within supply chain to verify recycled content used in steel parts in our products. Verification was done by an independent third party to a recycled content standard that conforms to ISO 14021. In FY22 Dell is only reporting verified recycled content for steel. Sustainable Materials in Packaging Measured in pounds unless otherwise noted Ocean-bound plastic used 73,366 118,875 227,595 Represents the amount of ocean–bound plastic incorporated into new Dell Technologies-branded product packaging, shipped to original design manufacturers. FY22 fiscal year reporting is dated 1/31/22. Responsible Electronics Disposition Percentage of product collected 9.1% 9.6% 12.1% This percentage is the total units collected for recycling and reuse over the amount of products sold. INTRO OUR PLAN GOALS DASHBOARD ADVANCING SUSTAINABILITY CULTIVATING INCLUSION TRANSFORMING LIVES ETHICS & PRIVACY SUPPLY CHAIN BY THE NUMBERS APPENDIX 140
 Our purpose in action | Dell Page 139 Page 141