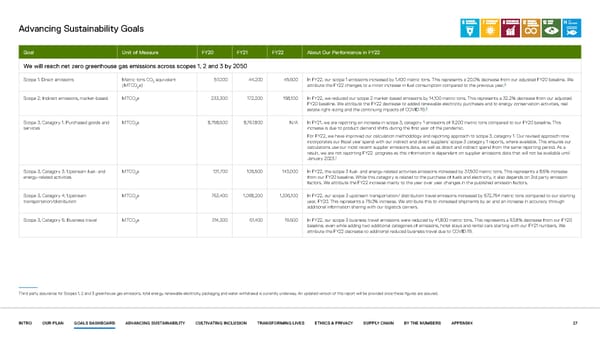
Advancing Sustainability Goals Goal Unit of Measure FY20 FY21 FY22 About Our Performance in FY22 We will reach net zero greenhouse gas emissions across scopes 1, 2 and 3 by 2050 Scope 1: Direct emissions Metric tons CO equivalent 57,000 44,200 45,600 In FY22, our scope 1 emissions increased by 1,400 metric tons. This represents a 20.0% decrease from our adjusted FY20 baseline. We 2 5 (MTCO2e) attribute the FY22 changes to a minor increase in fuel consumption compared to the previous year. Scope 2: Indirect emissions, market-based MTCOe 233,300 172,200 158,100 In FY22, we reduced our scope 2 market-based emissions by 14,100 metric tons. This represents a 32.2% decrease from our adjusted 2 FY20 baseline. We attribute the FY22 decrease to added renewable electricity purchases and to energy conservation activities, real estate right-sizing and the continuing impacts of COVID-19.6 Scope 3, Category 1: Purchased goods and MTCOe 8,758,600 8,767,800 N/A In FY21, we are reporting an increase in scope 3, category 1 emissions of 9,200 metric tons compared to our FY20 baseline. This 2 services increase is due to product demand shifts during the first year of the pandemic. For FY22, we have improved our calculation methodology and reporting approach to scope 3, category 1. Our revised approach now incorporates our fiscal year spend with our indirect and direct suppliers’ scope 3 category 1 reports, where available. This ensures our calculations use our most recent supplier emissions data, as well as direct and indirect spend from the same reporting period. As a result, we are not reporting FY22 progress as this information is dependent on supplier emissions data that will not be available until 7 January 2023. Scope 3, Category 3: Upstream fuel- and MTCOe 131,700 105,500 143,000 In FY22, the scope 3 fuel- and energy-related activities emissions increased by 37,500 metric tons. This represents a 8.6% increase 2 energy-related activities from our FY20 baseline. While this category is related to the purchase of fuels and electricity, it also depends on 3rd party emission factors. We attribute the FY22 increase mainly to the year over year changes in the published emission factors. Scope 3, Category 4: Upstream MTCOe 763,400 1,098,200 1,336,100 In FY22, our scope 3 upstream transportation/ distribution travel emissions increased by 572,754 metric tons compared to our starting 2 transportation/distribution year, FY20. This represents a 75.0% increase. We attribute this to increased shipments by air and an increase in accuracy through additional information sharing with our logistics carriers. Scope 3, Category 6: Business travel MTCOe 314,300 61,400 19,600 In FY22, our scope 3 business travel emissions were reduced by 41,800 metric tons. This represents a 93.8% decrease from our FY20 2 baseline, even while adding two additional categories of emissions, hotel stays and rental cars starting with our FY21 numbers. We attribute the FY22 decrease to additional reduced business travel due to COVID-19. Third-party assurance for Scopes 1, 2 and 3 greenhouse gas emissions, total energy, renewable electricity, packaging and water withdrawal is currently underway. An updated version of this report will be provided once these figures are assured. INTRO OUR PLAN GOALS DASHBOARD ADVANCING SUSTAINABILITY CULTIVATING INCLUSION TRANSFORMING LIVES ETHICS & PRIVACY SUPPLY CHAIN BY THE NUMBERS APPENDIX 27
 Our purpose in action | Dell Page 26 Page 28